There are four major components to a lab report.

  1. Introduction
  2. Methods
  3. Results
  4. Discussion


  1. Introduction
  2. In the introduction you want to explain to the reader the purpose of the experiment you just performed. You should clearly state the hypothesis or hypotheses that you tested. Finally mention how this hypothesis fits into your broader understanding of biology.

    Example:

    Acid rain is a major problem in the upper Midwest and Northeastern United States. This phenomenon is caused by the release of sulfates and nitrates into the air, which then combine with water to form sulfuric and nitric acid. Acid rain has a pH less than 5.0. Acid is harmful to most living things and can decrease plant growth. Animals living in water are also affected directly by pH. This experiment was designed to measure the effect of pH on the hatching of eggs from several species of aquatic animals. The hypothesis being tested in this experiment is that most eggs will not hatch at low pH values less than 5.0.


  3. Methods

In writing the Materials and Methods section, you need to describe what you did in such a way that other scientists can follow and duplicate your experiment. One of the most difficult things in writing a Materials and Methods section is deciding how much detail to give the reader. Too much detail can make this section excessively long. You should try to be concise, but complete.

Other pointers:


Example:

Eight different aquaria were each filled with 10 L of water and the pH adjusted to 4, 5, 6 or 7 with hydrochloric acid, two aquaria at each pH. Approximately 100 eggs from clams (Corbicula australis), brown trout (Salmo trutta) and bullfrogs (Rana catesbeiana) were added to each aquarium. The pH in each aquarium was measured daily with a pH meter and adjusted as necessary. The percent of eggs hatching from each species was measured daily.


  1. Results
  2. This section describes the results of your work, including tables, graphs and pictures or drawings. Be sure to include a written summary of the data found in your tables and figures, i.e. this section is more than just a series of graphs or tables. Recall that each axis of a graph needs to be labeled. You should include a title above each table and add figure legends beneath each graph. You should provide all of your raw data but you should not display the same data in multiple graphs or tables.

    Example 1:

    Frogs were the most resistant to decreases in pH, with 50% of the eggs hatching at a pH of 5 (Table I). The trout were the most sensitive, with 50% of the eggs hatching at a pH of 6. Clam sensitivity was in between, with 20% hatching at pH 5 and 70% hatching at pH 6. All three species showed the same rate of egg hatching at neutral pH (7.0).
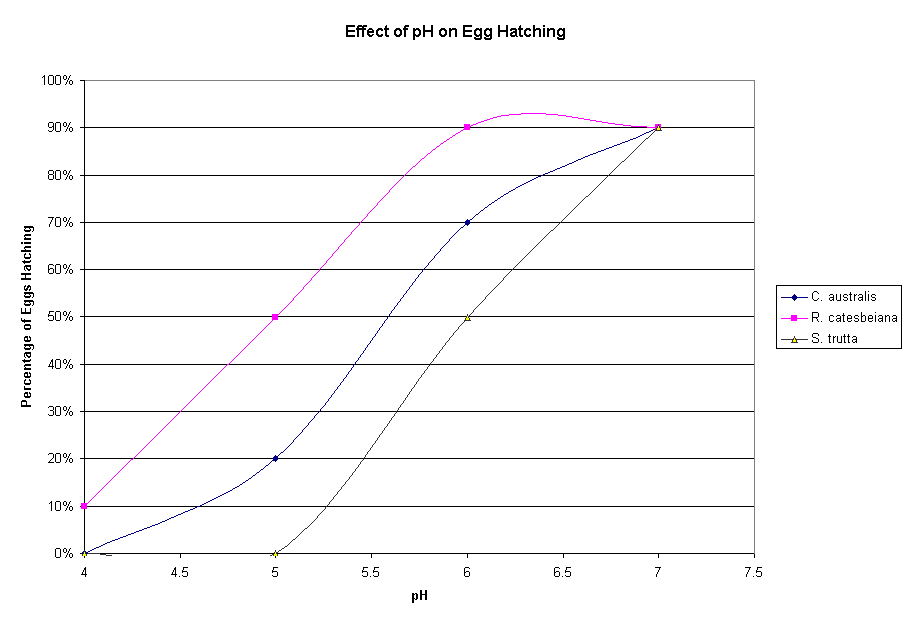
    Table I: Effect of pH on Egg Hatching.

    pH

    4

    5

    6

    7

    C. australis

    0%

    20%

    70%

    90%

    R. catesbeiana

    10%

    50%

    90%

    90%

    S. trutta

    0%

    0%

    50%

    90%

    OR

    Example 2:

    Frogs were the most resistant to decreases in pH, with 50% of the eggs hatching at a pH of 5 (Figure 1). The trout were the most sensitive, with 50% of the eggs hatching at a pH of 6. Clam sensitivity was in between, with 20% hatching at pH 5 and 70% hatching at pH 6. All three species showed the same rate of egg hatching at neutral pH (7.0).

    Figure 1. Eggs from each species were added to an aquarium at the indicated pH. Egg hatching rates were monitored for two weeks. Each point represents the average values from two aquaria.


  3. Discussion

In this section your should interpret your data and draw conclusions regarding your hypothesis. Avoid repeating the results section --evaluate your data and their implications in a broader context (i.e. why should anyone care about this?). A good way to do this is to restate your hypothesis and then describe which results supported your hypothesis and which did not. Then describe how your results fit into the bigger picture of scientific research.

Example:

We expected that as pH levels dropped that fewer eggs would hatch. Overall the data supported this trend, with all species showing decreased hatching at pH 5.0. There were differences among species, with frogs being the most resistant and trout the most sensitive to low pH. This may be due to the amount of time the eggs spend in the water, or other differences in the development of these animals. These results are important, because they illustrate the potential impact of acid rain on the health of aquatic animals.