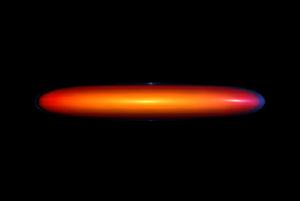

Observations of the HI distribution in many edge-on spiral galaxies reveal a charcteristic integral sign warp of the gas. The presence of warps can also be inferred from a velocity contour map, a.k.a. a "spider diagram". The warp usually begins at the edge of the optical disk and, in general, the stars do not take part in the warp.
Several ideas for the creation and maintenance of warps have been discussed in the literature. Magnetic fields, interacting galaxies, and bending mode orbits have all been used to describe warps. The picture that we follow is the following: 1)a disk exists in a nonspherical (actually oblate spheroidal) potential, 2) the angular momentum vector of the disk does not lie along the symmetry (z) axis of the potential, 3) the disk (which is differentially rotating) precesses, and 4) a twisted and warped disk results. Steiman-Cameron and Durisen (1984) have developed a tilted ring model along this line of thinking. The rings are nonself-gravitating, but there is viscosity between them. An analytical description of the rings gives the precession frequency and settling time in terms of the angle between the disk angular momentum and the potential symmetry axis and the degree of flattening of the potential.
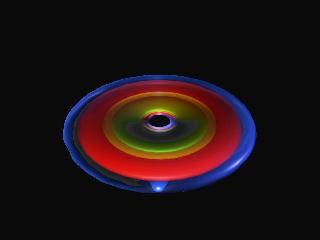
Using a finite difference hydrodynamics code, a gaseous disk in an oblate spheroidal potential which is tipped with respect to the disk's equatorial plane has been evolved. The self-gravity of the gas has been ignored for this simulation. Ignoring self-gravity approximates the behavior of low surface brightness (LSB) spiral galaxies since LSBs appear to be dominated by dark matter at almost all radii. The results are qualitatively consistent with the tilted ring models of Durisen & Steiman-Cameron. A quantitative comparison is being prepared.
We hope to extend this work further by next including the self-gravity of the gas. We also want to investigate some polar ring models.
Click on the image below to play a Quicktime movie of the nonself-gravitating disk evolution. The colored surfaces denote different isodensity surfaces; green is 80% of the maximum density, yellow is 10% of maximum, red is 1% of maximum, and blue is 0.1% of maximum.