◙◙◙◙◙◙◙◙◙◙◙◙◙◙◙◙◙◙◙◙◙◙◙◙◙◙◙◙◙◙◙◙◙◙◙◙◙◙◙◙◙◙◙◙◙◙◙◙◙◙◙◙◙◙◙◙◙◙◙◙◙◙◙◙◙◙◙◙◙◙◙◙◙◙◙◙◙◙◙◙◙◙◙◙◙◙◙◙◙◙◙◙◙◙◙◙◙◙◙◙◙◙◙◙◙◙◙◙◙◙◙◙◙◙◙◙◙◙◙◙◙◙◙
![]()
When negotiators bargain, the two sides often start at fairly distant or extreme bargaining positions and then they make concessions -- changes in their bargaining positions. The goal is to reach some mutually-acceptable middle ground. The pace at which these concessions proceed may be plotted to gain additional understanding of how both your side and the opposing side are bargaining. Who knows? You may discover that you are more predictable than you might like to think you are in how you make concessions!

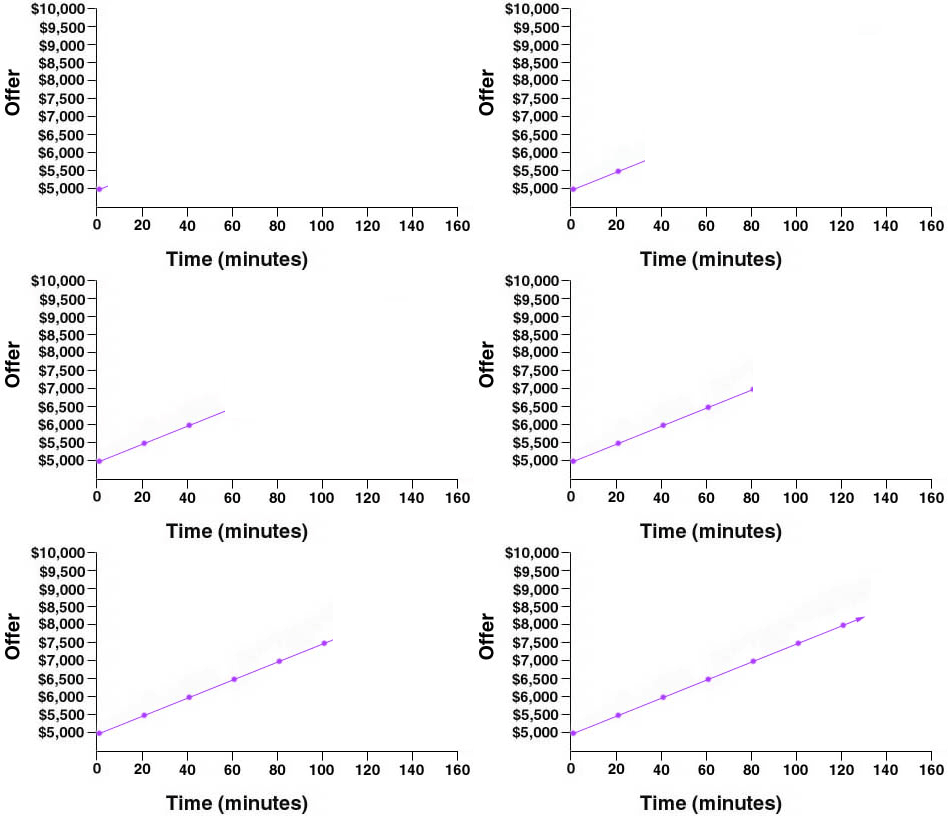
The x-axis (horizontal axis) of the graph is labeled "Time." The y-axis (vertical axis) of the graph is labeled "Offer." It refers to what the negotiator is proposing and will vary based on what the issue is that the negotiators are discussing.
Let's suppose that you are buying a used car and the issue under discussion is "price of the car." Suppose your initial offer is $5000. It would be plotted in the lower left corner of the graph. Now, suppose you hung around, kicked the tires, and kept talking to the dealer. Further, suppose that you increased your offer every 20 minutes by $500. Your graph would look like the straight line shown here.

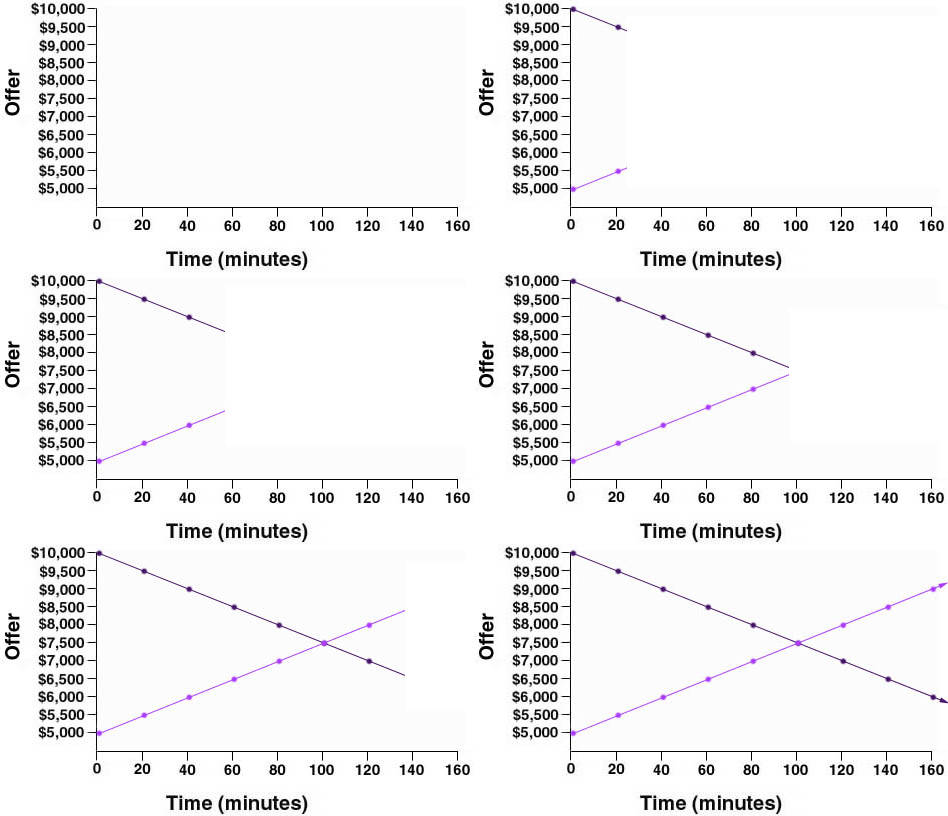
Now suppose that the used car dealer initially asked $10,000 for the car. This value would be plotted in the upper left corner of the graph. Further, suppose the dealer reduced his asking price by $500 every 20 minutes, perhaps in response to your new offers. His graph would look like the straight line shown here.

Eventually, the two lines cross. This is where you might predict the selling price of the car to be.

Please answer the following three Review Questions:
| Review Question #1: | ||
|---|---|---|
| What will the selling price of the car be? | ||
| a. $5,500 | ||
|
|
b. $6,500 | |
| c. $7,500 | ||
|
|
d. $8,500 | |
|
|
e. $9,500 |
|
◙◙◙◙◙◙◙◙◙◙◙◙◙◙◙◙◙◙◙◙◙◙◙◙◙◙◙◙◙◙◙◙◙◙◙◙◙◙◙◙◙◙◙◙◙◙◙◙◙◙◙◙◙◙◙◙◙◙◙◙◙◙◙◙◙◙◙◙◙◙◙◙◙◙◙◙◙◙◙◙◙◙◙◙◙◙◙◙◙◙◙◙◙◙◙◙◙◙◙◙◙◙◙◙◙◙◙◙◙◙◙◙◙◙◙◙◙◙◙◙◙◙◙