Introduction
Matrix Action
Perpframes, Aligners and Hangers
Stretchers
Coordinates
Projections
SVD
Matrix Subspaces
Linear Systems, Pseudo-Inverse
Condition Number
Matrix Norm, Rank One
Data Compression
Noise Filtering
Todd Will
UW-La Crosse
Projecting to a line
Projections
Simplified formula
Exercise
Hitting with one matrix and then another
Here's a perpframe![[Graphics:projectionsgr4.gif]](projectionsgr4.gif)
Plot an ellipse with a minor axis of 0.5 in the direction of ![]() and major axis of 1.2 in the direction of
and major axis of 1.2 in the direction of ![]() .
.
Answer: You know how to plot the unit circle:
![[Graphics:projectionsgr9.gif]](projectionsgr9.gif)
You know how to use an xy-stretcher to stretch the circle into an ellipse with the desired axes lengths:
![[Graphics:projectionsgr12.gif]](projectionsgr12.gif)
The ellipse you're looking at now is given by ![]()
![]() .
.
All you need to do is hang the ellipse on the perpendicular frame.
To do that you hit the curve ![]() with the
with the ![]() matrix.
matrix.
![]()
![[Graphics:projectionsgr19.gif]](projectionsgr19.gif)
An ellipse with a minor axis of 0.5 in the direction of ![]() and major axis of 1.2 in the direction of
and major axis of 1.2 in the direction of ![]() .
.
Just what the doctor ordered.
In the problem above you used two matrix hits to plot an ellipse.
Plot the same ellipse again, but this time use only one matrix hit.
Answer: Above, you defined a stretcher matrix and a hanger matrix and then plotted the results of a hit with the stretcher followed by a hit with the hanger:
![[Graphics:projectionsgr23.gif]](projectionsgr19.gif)
If you multiply the out (hanger) (stretcher)
you get:
Now hit the unit circle with the product:
![[Graphics:projectionsgr26.gif]](projectionsgr19.gif)
Apparently,
the action of the matrix product: product = (hanger) (stretcher)
is the same as
the action of the stretcher followed
by the action of the hanger.
Key point:
The action of a matrix product: A=B C is the same as the action
of the C followed by the action of B.
The point on a line through {0,0} closest to P.
Here's a plot of the point![[Graphics:projectionsgr28.gif]](projectionsgr28.gif)
What point on the x-axis is closest to the point ![]() ?
?
Answer: It's gotta be the point ![]() .
.
Click here only if you're in doubt about this.
What point on the y-axis is closest to the point ![]() ?
?
Answer: It's gotta be the point ![]() .
.
Click here only if you're in doubt about this.
How can you get these closest points with matrix hits?
Answer: To get the closest
point on the x-axis, hit ![]() with the xy-stretcher that squashes the y-coordinate but leaves the x-coordinate
unchanged.
with the xy-stretcher that squashes the y-coordinate but leaves the x-coordinate
unchanged.
The xy-stretcher you want is ![]() .
.
Check: ![]()
![]() =
=![]()
To get the closest point on the y-axis hit ![]() with the xy-stretcher that squashes the x-coordinate but leaves the y-coordinate
unchanged.
with the xy-stretcher that squashes the x-coordinate but leaves the y-coordinate
unchanged.
The xy-stretcher you want is ![]() .
.
Check: ![]()
![]() =
=![]()
Here's a plot of a perpframe and the point ![]() .
.
![[Graphics:projectionsgr60.gif]](projectionsgr66.gif)
The plot also shows lines through ![]() parallel to
parallel to ![]() and
and ![]()
What point on the green line is closest to the point ![]() ?
?
Answer: This is a lot harder than
asking what point on the x-axis is closest to ![]() .
.
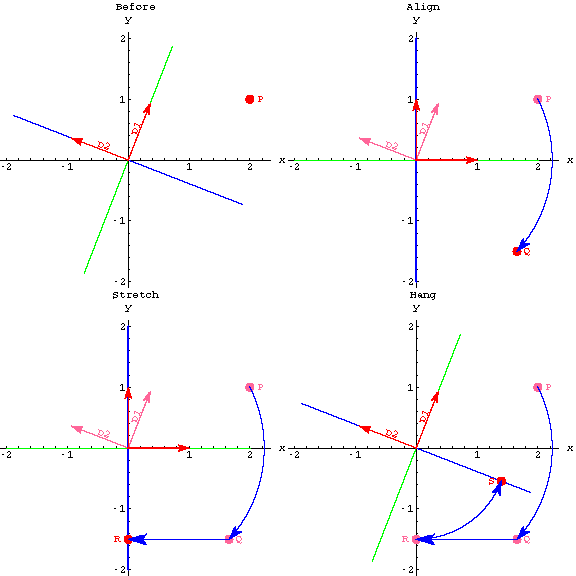
Look at the following plots.
![[Graphics:projectionsgr66.gif]](projectionsgr66.gif)
![[Graphics:projectionsgr67.gif]](projectionsgr67.gif)
![[Graphics:projectionsgr68.gif]](projectionsgr68.gif)
![[Graphics:projectionsgr69.gif]](projectionsgr69.gif)
S is the point on the green line closest to ![]() .
.
Explain how the S got where it did.
Answer: Look again at the first two plots.
![[Graphics:projectionsgr71.gif]](projectionsgr66.gif)
![[Graphics:projectionsgr72.gif]](projectionsgr67.gif)
You get from the first plot to the second plot by rotating the perpframe
vectors ![]() and
and ![]() to the x and y axes.
to the x and y axes.
This rotates the green line to the x-axis and the point ![]() to the new position
to the new position ![]() .
.
You get this rotation with the ![]() .
.
Look at the second and third plots:
![[Graphics:projectionsgr78.gif]](projectionsgr67.gif)
![[Graphics:projectionsgr79.gif]](projectionsgr68.gif)
R is the point on the x-axis closest to Q.
You can get R by hitting Q with the ![]() .
.
This squashes Q's y-coordinate, but leaves the x-coordinate unchanged.
Look at the third and fourth plots:
![[Graphics:projectionsgr81.gif]](projectionsgr68.gif)
![[Graphics:projectionsgr82.gif]](projectionsgr69.gif)
Here you rotate the xy-axis back to the perpframe vectors.
The point R gets rotated to S.
This is a job for the ![]() .
.
Summary: You arrived at S by hitting
P,
-
first with
![[Graphics:projectionsgr84.gif]](projectionsgr84.gif) ,
, -
then with
![[Graphics:projectionsgr85.gif]](projectionsgr85.gif) ,
, -
and finally with
![[Graphics:projectionsgr86.gif]](projectionsgr86.gif) .
.
This says you can get the coordinates of the point on the green line
closest to ![]() by computing
by computing
Compute this point and add it to the plot
![[Graphics:projectionsgr91.gif]](projectionsgr91.gif)
Looks good.
Take a look at the original setup again.
What point on the blue line is closest to the point ![]() ?
?
![[Graphics:projectionsgr93.gif]](projectionsgr66.gif)
Answer: This time you should
try to imagine the picture for each step:
-
Use the aligner matrix to rotate the
![[Graphics:projectionsgr94.gif]](projectionsgr94.gif) and
and ![[Graphics:projectionsgr95.gif]](projectionsgr95.gif) to the xy-axis.
to the xy-axis. - Use a stretcher matrix to find the point on the y-axis (the new location of the blue line) closest to Q.
- Use the hanger matrix to rotate back to the original perpframe.
This rotates P to a new position Q.
You use ![]() for
the stretcher since you want to squash the x but leave the y unchanged.
for
the stretcher since you want to squash the x but leave the y unchanged.
Compute ![]() and add it to the plot.
and add it to the plot.
![[Graphics:projectionsgr99.gif]](projectionsgr99.gif)
Looks good.
It's good to be able to imagine all of the matrix action that leads
from ![]() to the blue dot, but you deserve to see it too.
to the blue dot, but you deserve to see it too.
Enjoy!
The point on a plane through {0,0,0} closest to P.
Here's a plot of a point![[Graphics:projectionsgr103.gif]](projectionsgr103.gif)
The plot also shows the plane through ![]() spanned by
spanned by ![]() and
and ![]()
What point on the plane is closest to the point ![]() ?
?
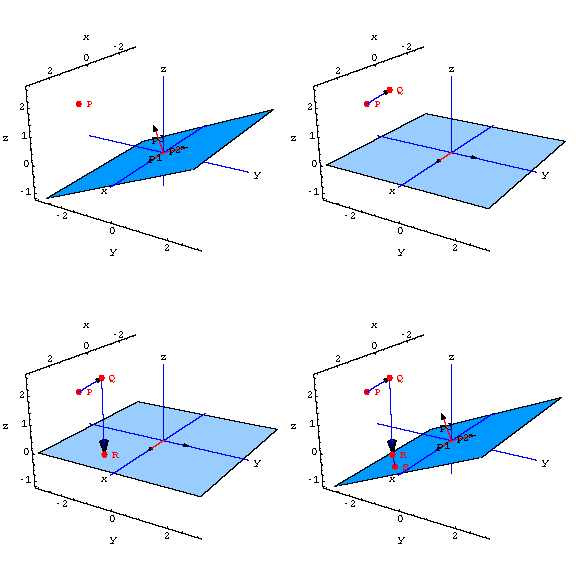
Answer this question in stages.
First align the plane spanned by ![]() and
and ![]() with the xy-plane.
with the xy-plane.
Do this by hitting with the aligner=![]() .
.
![[Graphics:projectionsgr112.gif]](projectionsgr112.gif)
The aligner has rotated the perpframe to xyz-axis.
The original plane has been rotated to the xy-plane.
The point P has been rotated to the point Q.
The distances from P to the original plane are the same as distances from Q to the xy-plane.
But finding the point on the xy-plane closest to Q is a snap.
Just hit Q with a stretcher matrix that leaves the x and y coordinates
unchanged, but squashes the z coordinate.
![[Graphics:projectionsgr113.gif]](projectionsgr113.gif)
![[Graphics:projectionsgr114.gif]](projectionsgr114.gif)
Now hang the plane back in its original position to find the point closest to P.
Do this with the hanger matrix.
![[Graphics:projectionsgr115.gif]](projectionsgr115.gif)
![[Graphics:projectionsgr116.gif]](projectionsgr116.gif)
-
first with
![[Graphics:projectionsgr117.gif]](projectionsgr117.gif) ,
, -
then with
![[Graphics:projectionsgr118.gif]](projectionsgr118.gif) ,
, -
and finally with
![[Graphics:projectionsgr119.gif]](projectionsgr119.gif) .
.
Simplified formulas.
You'll see later that the productMore generally, (but without the pictures), if
-
![[Graphics:projectionsgr124.gif]](projectionsgr124.gif) is an orthonormal basis for
is an orthonormal basis for ![[Graphics:projectionsgr125.gif]](projectionsgr125.gif)
-
and S is the subspace spanned by
![[Graphics:projectionsgr126.gif]](projectionsgr126.gif) ,
r<m.
,
r<m.
![[Graphics:projectionsgr127.gif]](projectionsgr127.gif)
Exercise
1. Here's a plot of a perpframe and the curve{x[t],y[t]}={1+Cos[t] (0.2 -Sin[t]) Sin[t], 1.2 +Cos[t] (0.6 -Sin[t])}
![[Graphics:exercisegr1.gif]](exercisegr1.gif)
Hitting this curve with the stretcher matrix ![]() reflects the curve across the y-axis.
reflects the curve across the y-axis.
![[Graphics:exercisegr4.gif]](exercisegr4.gif)
Your job is to define matrices A, B, C, (in terms of ![]() and
and ![]() ),
so that the matrix product ABC reflects the curve across the green
line as shown below:
),
so that the matrix product ABC reflects the curve across the green
line as shown below:
![[Graphics:exercisegr7.gif]](exercisegr7.gif)

